


Primary means of transportation in the US
Motor vehicle
Number of people killed in 2016
37,461 people killed
In 2016 (most recent certified statistics):
- Distraction-relateddeaths(3,450fatalities)decreasedby2.2percent;
- Drowsy-driving deaths (803 fatalities) decreased by 3.5 percent;
- Drunk-driving deaths (10,497 fatalities) increased by 1.7 percent;
- Speeding-relateddeaths(10,111fatalities)increasedby4.0percent;
- Unbelted deaths (10,428 fatalities) increased by 4.6 percent;
- Motorcyclist deaths (5,286 fatalities – the largest number of motorcyclist fatalities since 2008) increased by 5.1 percent;
- Pedestriandeaths(5,987fatalities–thehighestnumbersince1990) increased by 9.0 percent; and
- Bicyclist deaths (840 fatalities – the highest number since 1991) increased by 1.3 percent.
Fatality Occupants by Type (2016)
Passenger Cars
Light Trucks
Large Trucks
Motorcycles
Number of Fatalities - Passenger Cars
13,412
Number of Fatalities - Light Trucks
10,302
Number of Fatalities - Large Trucks
722
Number of Fatalities - Motorcycles
5,286
Nonoccupants by Type (2016)
Pedestrian
Pedalcyclist
Other/Unknown
Number of Fatalities - Pedestrian
5,987
Number of Fatalities - Pedalcyclist
840
Number of Fatalities - Other/Unknown
252
Seat Belt Laws
In 2016, 49 States and DC had seat belt laws
Exception: NewHampshire
From 1975 through 2014, NHTSA estimates seat belts saved
If all passenger vehicle occupants over age 5 wore seat belts
an additional 2,814 lives would have been saved in 2014
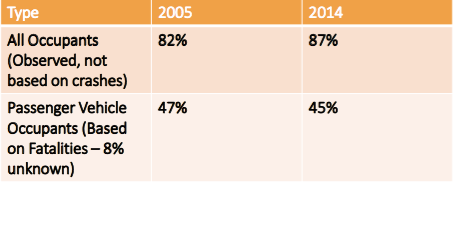
Restraint Use Rates
In 2016 alcohol-impaired-driving fatalities
10,497 (28% of total traffic fatalities)
NHTSA considers a crash to be speeding-related if
if the driver was charged with a speeding-related offense or if an officer indicated that racing, driving too fast for conditions, or exceeding the posted speed limit was a contributing factor.
most prevalent factors contributing to traffic crashes
Speeding with 10,428 lives lost in speeding-related crashes.
Why is Roadway Safety Design Challenging?
- Human error is generally considered to have caused or contributed to more than 90% of all crashes.
- Level of safety to design for
- Lack of “factor of safety” for highway design
Level of safety to design for
Safe
Substantive Safety
Nominal Safety
Unsafe
Safety Roles for the Engineer
- Prevent hazardous situations
- Use latest design standards and guidance
- Maintain safe roadways (including roadside) and roadway devices
- Maintain safe roadway structures (bridges and tunnels) Analyze problem safety areas
- Plan for safety improvement strategies
- Accommodate all roadway users
Safety Concerns - not comprehensive
- Human Factors
- Speed Management
- Intersection Safety
- Roadway Departure
- Pedestrian/Bicycle Safety
- Work Zone Safety
Safety Practices - not comprehensive
- Roadway Safety Assessments
- Safety Data Analysis
- Safety Predictive Methods
- Safety Planning
- (Traffic Enforcement)
- (Crash Investigations)
- (Vehicle Safety)
Design Standards and Guidelines
- A Policy on Geometric Design of Highways and Streets
- Roadside Design Guide
- Manual on Uniform Traffic Control
Devices for Streets and Highways
- Highway Safety Manual
- Human Factors Guidelines